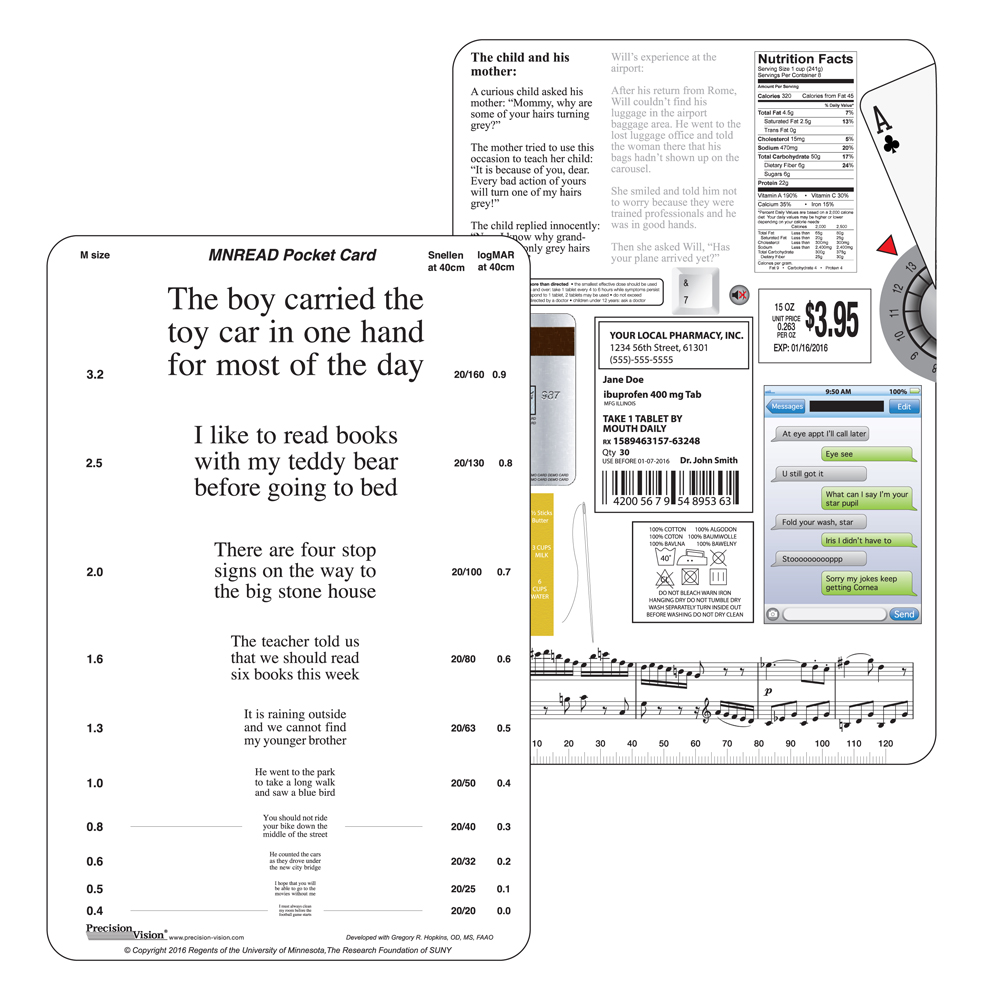
The MNREAD Acuity Charts are continuous text reading acuity charts for normal and low vision.
Often times traditional vision charts only measure general parts of normal vision, such as acuity and contrast. However, many times everyday life scenarios place these two aspects in unique situations. For example, acuity is very important in vision. Testing acuity normally involves a standard eye test. However, when reading the newspaper, the eyes are challenged by small print, continuous text, and several close contact lines. This basic living situation may cause problems for patients with scotomata and may not be detected on conventional acuity charts. Continuous text charts give one more possibility during vision testing.
The charts are used to assess how reading performance depends on print size. Three measures of reading performance are easily obtained: Reading acuity the smallest print that can just be read; Maximum reading speed the reading speed when performance is not limited by print size; and Critical print size the smallest print that supports the maximum reading speed.
The MNREAD Acuity Charts have a wide range of applications in testing normal and low vision: prescribing optical corrections for reading, or other near tasks in the eye clinic, in low vision assessment, prescribing magnifiers or other reading aids, applications in pediatrics and special education, and research.
Included are preferred scoring procedures, table for conversion and instructions.
The MNREAD Acuity Charts were developed at the Minnesota Laboratory for Low-Vision Research, University of Minnesota, by:
• Steve Mansfield
• Gordon Legge
• Andrew Luebker
• Kathryn Cunningham
The research was funded and approved by the NIH.
Background: White
Language: English
Chart Type: 1
Language: English
Chart Type: 1


